Warrant heatmap
The warrant heatmap allows you to quickly see which underlying shares or indices are bullish or bearish in the short to medium term. This new tool is based on the TradeVSA proprietary algorithm, which uses the Volume Spread Analysis methodology.
Search for your preferred underlyings or filter for an underlying with a strong momentum or trend. You can use the charts to see the TradeVSA indicators and easily view all associated Macquarie warrants.
Please mouseover each column’s header for more information.
Introduction
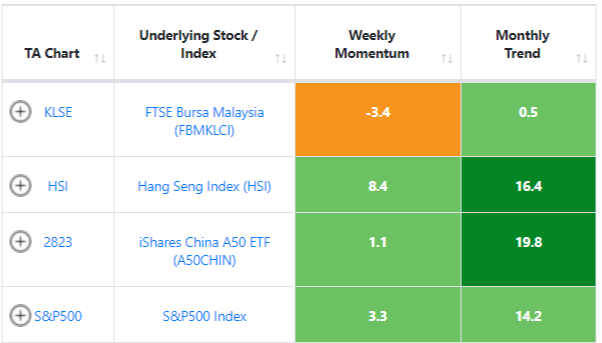
Make full use of our Warrant Heatmap to quickly determine the short term momentum or medium term trend of an underlying.
The Weekly Momentum and Monthly Trend columns display a score of how bullish (positive scores; the higher the stronger) or bearish (negative scores; the lower the stronger) TradeVSA’s proprietary algorithm is on that underlying. The Weekly Momentum is for a weekly lookout of 4 to 12 weeks, while the Monthly Trend is for a monthly lookout of 3 to 6 months. Please note that these are strength scores or meters and are not an indication of how high or low the underlying will move.
Below are features of the Warrant Heatmap:
- Search box – view the momentum or trend and the available warrants of your preferred underlying by typing its name or stock code in the search box
- Reset button – click on this button to clear all searches and filters, and return to the default page
- Filter by – simply click on the filter tool with the dropdown to filter available underlyings based on their momentum or trend. Full bullish means that the underlying is bullish in weekly momentum and monthly trend.
- Entries selection – select the maximum number of entries (underlyings) you would like displayed on one page
- Momentum/trend color legend – shows the strength of a momentum or trend with different colors so that you can interpret the heatmap easily
- Red – Strong bearish
- Orange – Weak bearish
- Light green – Weak bullish
- Dark green – Strong bullish
Warrant tools
Warrant statistics
Warrant education
 A gentle reminder, Macquarie Capital Securities (Malaysia) Sdn Bhd will never ask you to open an account or transfer money to individual accounts through social networking services such as Whatsapp or Instagram. If you encounter similar advertisements or receive similar calls, please do not provide any personal financial information, and contact us at 03-2059 8833.
- Warrant tools
- Warrant statistics
- Warrant education
- Market news
© Macquarie Group Limited ABN 94 122 169 279. All rights reserved
© Macquarie Group Limited ABN 94 122 169 279. All rights reserved